
2026 Midterm Elections

2026 Midterm Elections
With the midterm elections now behind us, we felt it worthwhile to share comments from our investment managers on what the results may mean for the policy outlook and financial markets.
Democrats won control of both the House and the Senate, ending unified Republican control of the federal government and setting up a divided government when the new Congress takes office on January 3. The scale of the result was notable, as the Democratic party won majorities in both chambers of Congress, and for the first time since 2010, will hold a majority of U.S. governorships. In the House, Democrats won the national vote by a double-digit margin, the largest midterm margin since 1974, and their total is projected to land well above the 218 seats needed for control. Kansas elected its first Democratic senator since 1932, and Democrats
also flipped Senate seats in Republican strongholds in Texas and South Carolina, underscoring the scale of the victory. Investment managers noted that the new alignment may prove more durable than a typical midterm shift, given that Senate terms run six years.
Markets reacted to the election result in two stages. U.S. stocks rallied the day after the election, with the S&P 500 up 1.6%, as the outcome eased political uncertainty, while Treasury yields and the dollar moved lower. Investment managers viewed the initial move as reasonable, given reduced political uncertainty, moderating growth, and potential less pressure on inflation, while noting that profit growth in the AI complex was an area to watch. That concern surfaced later in the week, as equities ended the week lower on worries that tighter federal and state oversight of AI and data centers could slow the buildout. Investment managers emphasized the election did not change the concentration of market returns in AI-related companies, reinforcing the case for diversification across themes as well as asset classes. Bond investors, by contrast, see a divided Washington as supportive for Treasuries, pricing in a potential resolution to the War in Iran and a shift in tariff policies that have been inflationary.
Investment managers expect the policy agenda for Democrats to focus on “affordability” and “accountability.” Whether affordability initiatives are emphasized over accountability, including possible Federal investigations and impeachments of senior Republican cabinet members, will likely result in two possible paths. The first is gridlock, supported by the president’s veto authority and limited trust between the parties. The second is cooperation, supported by majorities large enough to give Democratic leadership votes to spare (limiting the leverage of the party’s left flank and making bipartisan deals easier to pass), the president’s stated willingness to work with incoming leaders, and must-pass legislation that could carry broader compromise. Neither path points to a large stimulus package before 2028, which, along with the potential for lower trade tensions and energy prices, could reduce the need for further tightening from the Fed. Persistent deficits are likely to limit how far longer-term yields decline, while a softer dollar and easing trade pressures could support international equities.
As for what this means for clients’ investment portfolios, we do not believe the results warrant a material change in positioning, but the new political alignment may reinforce themes already important to markets: greater scrutiny of AI spending and capital expenditures, possible easing of trade tensions, and a possible more benign inflation backdrop. Taking a closer look, these are several issues worth watching:
- AI and data centers: Electricity prices, water usage, and consumer protections have drawn bipartisan attention. Investment managers expect state and local requirements to raise costs and extend timelines rather than broad federal restrictions, making the cost and pace of the buildout the relevant question for investors. Texas, Georgia, and Ohio all elected governors and state officials whocampaigned on more restrictive development policies. Collectively, these three states account for an estimated 37% of the announced U.S. data center capacity pipelines through 2030.1
- Tariffs: One view is that effective tariff rates will decline into 2027 as members of both parties respond to affordability concerns. Others emphasize that the executive branch retains broad discretion over trade, meaning a reduction would likely require the administration itself to change course.
- Health care and energy: Insurance subsidies and energy permitting reform are seen as areas where agreement is most plausible, though timing may slip into next year.
- Government funding and the debt limit: Current funding expires in early December, and investment managers expect an extension of existing spending levels into early next year. The debt limit may be reached around the summer of 2027, and views differ on whether it becomes a routine extension or a point of negotiation over spending and health care.
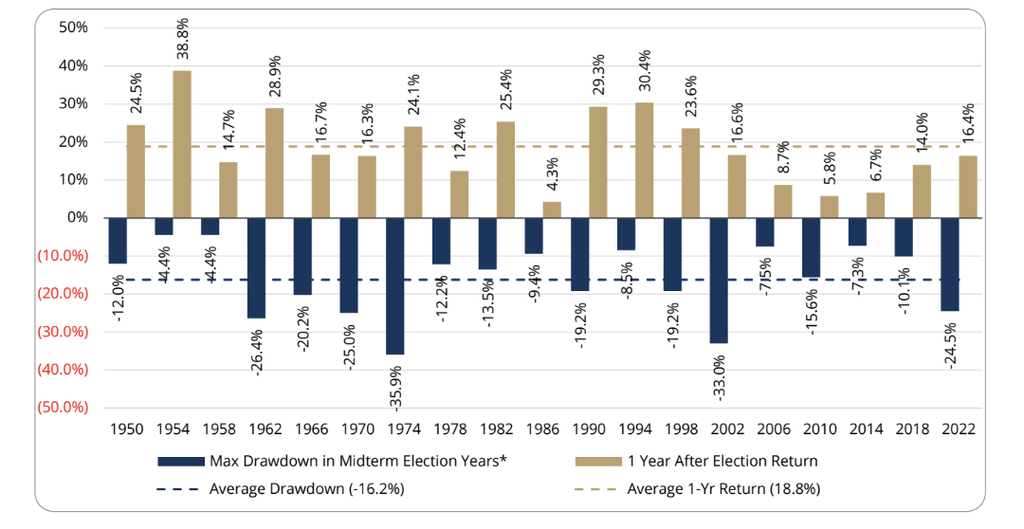
Equities have historically tended to trade sideways ahead of midterm elections, then rebound as political uncertainty recedes. As highlighted in the chart below, the S&P 500 Index max drawdown from the start of the midterm election year to election day has averaged -16.2%, while the average 1-year return following the election has averaged 18.8%. In 2026, the max drawdown experienced was -5.6%, and the potential for a strong rebound is complicated by continued geopolitical conflicts, volatility around the AI investment boom, and sticky inflation.
Midterm Election Year Drawdowns
S&P 500 Index Max drawdown from start of midterm election year to election day vs. S&P 500 Index Return after midterm election 2
Rather than attempt to predict short-term market movements, we continue to favor a disciplined, diversified approach while remaining prepared to capitalize on opportunities that emerge when volatility, valuation disparities, or market dislocations create attractive long-term entry points. As always, we welcome the opportunity to discuss your portfolio in detail and appreciate the trust and confidence that you have placed in Prairie Capital. We look forward to connecting with you soon.
Sincerely,
Prairie Capital Management Group, LLC
Important Disclosures
Past performance is not an indication of future results. This publication does not constitute, and should not be construed to constitute, an offer to sell, or a solicitation of any offer to buy, any particular security, strategy, or investment product. This publication does not consider your particular investment objectives, financial situation, or needs, should not be construed as legal, tax, financial or other advice, and is not to be relied upon in making an
investment or other decision.
Certain information contained herein has been obtained or derived from unaffiliated third-party sources and, while Prairie Capital Management Group, LLC (“Prairie Capital”) believes this information to be reliable, makes no representation or warranty, express or implied, as to the accuracy, timeliness, sequence, adequacy, or completeness of the information. The information contained herein, and the opinions expressed herein, are those of Prairie Capital
as of the date of writing, are subject to change due to market conditions and without notice and have not been approved or verified by the United States Securities and Exchange Commission (the “SEC”), the Financial Industry Regulatory Authority (“FINRA”), or by any state securities authority. This publication is not intended for redistribution or public use without Prairie Capital’s express written consent.
1 Source: Partners Group (2026), Aterio, Jeffries. Data compiled as of November 4, 2026.
2 Source: First Trust, Bloomberg, Data from 1950-2024. *Max drawdown covers period from beginning of the year of the midterm election to election date.
Related Learning

December 20, 2025