Fourth Quarter 2024 Market Update

Almost nobody has ever predicted the timing, magnitude and/or shape of any bear market, recession or inflation.” – Multi-Strategy Hedge Fund Manager
Fourth Quarter 2024 Market Update
The year 2024 delivered another strong period of investment returns across most asset classes. Despite the absence of a traditional “Santa Claus” rally in December, with the S&P 500 declining -2.5% during the month, the index still achieved an impressive +25.0% gain for the year. This follows a similarly strong performance in 2023 (+26.3%), marking the best two-year return for the index since the late 1990s tech boom, with a surge of over 2,000 points. The fourth quarter saw a resurgence of familiar trends: intense market focus on artificial intelligence (AI) companies, large-cap domestic equities outperforming their smaller counterparts, and continued dominance of U.S. stocks over international markets.
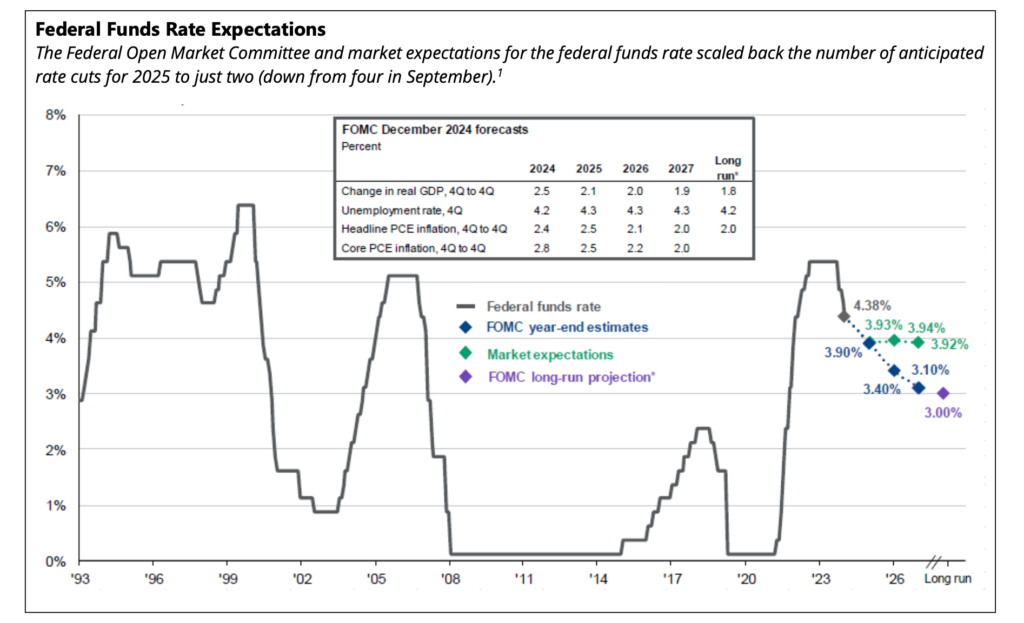
U.S. economic data continued to be resilient, as annualized gross domestic product (“GDP”) growth remained strong at +3.1% in Q3. The labor market data was more volatile, having been distorted by strikes and hurricanes, as non-farm payrolls rose by just 36,000 in October, before a stronger November that followed included a 227,000 net gain. Inflation continued to normalize over the period, leading to additional action by the U.S. Federal Reserve (“Fed”). After initiating its rate-cutting cycle with a 50 basis point (0.50%) reduction in September, the Fed continued with 25 basis point (0.25%) decreases in both November and December. However, the December reduction unexpectedly triggered equity market volatility. This stemmed from the Fed’s revised guidance, which scaled back the number of anticipated rate cuts for 2025 to just two (down from four in September). This suggested a more cautious approach from the central bank, continuing to utilize a data-driven approach, and signaling its commitment to price stability as it navigates a complex economic environment.
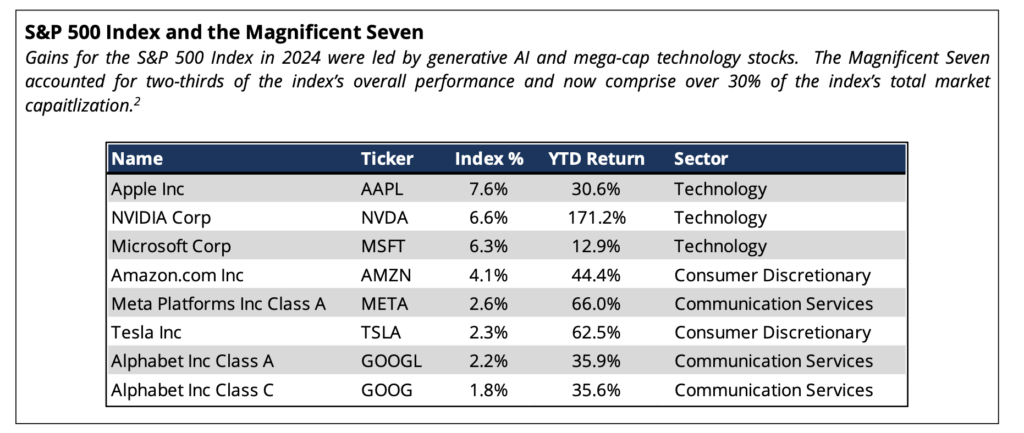
Domestic equity markets, as measured by the S&P 500 Index, delivered a solid +2.4% gain in the fourth quarter, bringing their year-to-date return (“YTD”) to an impressive +25.0%. This marks a remarkable surge of nearly 60% for the index over the past two years. However, 2024’s gains were heavily concentrated in generative AI and mega-cap technology stocks (the “Magnificent Seven”), which drove two-thirds of the index’s overall performance. These companies now comprise over 30% of the index’s total market capitalization, raising concerns about market concentration. While market breadth showed improvement in the third quarter, it narrowed considerably in the fourth quarter, with the average stock within the index returning approximately +13% for the calendar year and the median stock rising less than 10%. Notably, over 30% of stocks in the index finished the year in negative territory. From a sector perspective, performance diverged significantly. Consumer Discretionary (+14.3%, +30.1% YTD), Communication Services (+8.9%, +40.2% YTD),and Financials (+7.1%, +30.6% YTD) led the way, while Materials (-12.4%, +0.0% YTD), Health Care (-10.3%,+2.6% YTD), and Real Estate (-8.5%, +5.0% YTD) lagged considerably. This divergence also played out in market-cap and investment-style, with large-cap and growth stocks significantly outperforming their small-cap and value counterparts.
International developed equities, as measured by the MSCI EAFE Index, faced headwinds this quarter, declining -8.1% and reversing much of their gains from earlier in the year. Despite this, the index still returned +3.8% YTD, though significantly lagging U.S. market performance. This underperformance stemmed from several factors, including political uncertainty in the Eurozone, concerns about a potential recession, and worries over escalating global trade tensions. In response to these economic challenges, the European Central Bank (“ECB”) cut interest rates by 25 basis points (0.25%) in both October and December, signaling a continued easing monetary policy in 2025. Emerging markets equities, as measured by the MSCI Emerging Markets Index, declined -8.0% for the period (+7.5% YTD). This weakness was largely attributed to concerns about potential increases in trade tariffs, particularly those impacting China, which are being discussed by the incoming administration.
Fixed income markets experienced a challenging fourth quarter, with the Bloomberg U.S. Aggregate Index declining -3.1%. Despite this, the index ended the year with a modest gain of +1.3%, marked by elevated volatility. Rising U.S. government bond yields, driven by expectations of pro-growth policies and continued economic resilience, contributed to the negative returns. This trend was particularly evident in the long end of the Treasury yield curve, which steepened significantly, despite the Fed’s cumulative 1.0% in rate cuts since
September. The 10-year Treasury yield closed the year at 4.6%, up approximately 80 basis points from the previous quarter. In contrast to Treasuries, credit markets remained strong, with spreads narrowing to near- historical lows. The Bloomberg U.S. Credit and Corporate High Yield indices ended the year at spreads of 71 and 253 basis points, respectively, reflecting levels not seen since before the Global Financial Crisis. Within corporate bonds, high-yield outperformed investment-grade for both the quarter and the year. Other fixed income sectors, including municipals, mortgage- and asset-backed securities, also posted negative returns for the quarter but finished the year in positive territory.
Beyond traditional asset classes, commodities delivered mixed returns in the fourth quarter. While the broad S&P GSCI Index ended the period with gains, performance varied significantly across individual commodities. Gold, for example, experienced a late-quarter decline due to a surge in the U.S. dollar. However, it still delivered strong gains for the year, benefiting from inflationary pressures and geopolitical uncertainty, ultimately outperforming even the S&P 500 Index with a return of over +28%. Oil prices also rose during the quarter, driven by higher demand expectations and continued supply discipline from OPEC. Digital assets, meanwhile, posted significant gains as market sentiment improved. This positive momentum was fueled by signals of support from the new administration and anticipation of a more constructive regulatory framework for the cryptocurrency sector.

Election Outcomes and Implications for Markets
“Too often, however, we see investors get over excited, as if who controls Congress or the White House should fundamentally change how they invest. We think the better course is to stay calm and do not overreact and, in a world with so much uncertainty, avoid being overconfident.” – Private Equity Manager
While pre-election fears centered around policy uncertainties, risk assets ultimately responded with enthusiasm to the results of November’s election. President Trump’s decisive re-election, which defied most pollsters’ predictions of a nail-biter race, ignited a strong market rally. The S&P 500 surged nearly +3% on the day following the election, marking its best post-election day performance in history. This exuberance extended beyond large-cap stocks, with small-cap stocks soaring almost +6%. The positive sentiment reverberated across various asset classes, as evidenced by a surge in Bitcoin prices, a tightening of credit spreads, and a palpable sense of optimism among investors.
This wave of market confidence stemmed not only from the presidential election outcome but also from the decisive shift in the balance of power in Congress. With the president’s party securing a majority in both the Senate and the House of Representatives, investors anticipated a smoother path for implementing the administration’s economic agenda, which could have significant implications for the overall economy. This agenda, widely perceived by economists and market analysts to be favorable for U.S. growth, centers on revitalizing domestic activity. Key priorities include bolstering energy production, streamlining regulations, and fostering a supportive environment for mergers and acquisitions. These pro-growth initiatives are expected to strengthen the U.S. dollar and create a favorable climate for businesses. In addition, President Trump has also discussed significant tax reform – both for individuals (extending tax cuts, lifting the cap on state and local tax deductions, etc.) as well as corporations (reducing corporate tax rates).
However, amidst this optimism, some market observers have voiced concerns about potential inflationary pressures associated with certain aspects of the agenda, particularly regarding the possibility of new trade tariffs as well as significant immigration reform. While the overall impact on economic activity is anticipated to be positive, the implementation of these policies will require time and could also result in a broad array of outcomes. As one of our seasoned portfolio managers astutely observed, “politics remains a messy business,” underscoring the inherent difficulty in precisely forecasting the timing and magnitude of policy-driven economic shifts.
Final Thoughts
“As we enter 2025, we believe that the market faces an inflection point where sustaining momentum becomes increasingly difficult. Concentration and valuation risks are poised to hinder market-cap weighted index level returns.” – Domestic Equity Manager
Following another year of exceptional market performance, most economists maintain a positive outlook for the year ahead, citing an economy that appears to be on solid footing. Several factors support this optimism: inflation, while still above long-term targets, appears to be moderating; a favorable economic policy agenda is anticipated; investor sentiment remains buoyant; and consumer and corporate balance sheets are healthy. However, a key question lingers: how much of this positive outlook is already reflected in current market valuations?
As we have emphasized in the past, while market valuations may not be reliable predictors of short-term returns, they offer valuable insights into long-term potential. Currently, valuation metrics appear elevated. Both the current and forward price-to-earnings (P/E) ratios for the S&P 500 Index are near the top decile historically. Furthermore, much of the 2024 market gains were driven by multiple expansion, meaning investors were willing to pay a higher price for each dollar of earnings. With a forward P/E ratio of 22x, further multiple expansion seems unlikely. Therefore, future returns will need to be fueled primarily by earnings growth. Currently, the market consensus anticipates a two-year earnings growth rate of 30%, a significant acceleration compared to the previous two years. While not impossible, this level of growth represents an ambitious expectation. In our view, caution is warranted. With valuations already at elevated levels, there is limited room for error.
As we embark on 2025, it is prudent to reflect on the remarkable market performance of recent years while also acknowledging the potential for a shift in the investment landscape. While most economists remain optimistic about the year ahead, citing a robust economy and favorable policy environment, we encourage investors to maintain a balanced perspective. After back-to-back years of equity returns exceeding 20%, it is crucial to avoid anchoring future expectations to these exceptional gains. Zooming out and considering historical market trends can provide valuable context for what might constitute realistic return expectations in the current environment. Beyond managing expectations, we also advocate for a renewed focus on portfolio diversification. The robust performance of risk assets in recent years may have led to allocation drift, with portfolios becoming unintentionally overweight equities. Rebalancing your portfolio to ensure alignment with your long-term goals and risk tolerance is essential for navigating potential market volatility. This proactive approach can help mitigate downside risk and position your portfolio for long-term success.
As always, we welcome the opportunity to discuss your portfolio in detail and appreciate the trust and confidence that you have placed in Prairie Capital. We look forward to connecting with you soon.
Important Disclosures
Past performance is not an indication of future results. This publication does not constitute, and should not be construed to constitute, an offer to sell, or a solicitation of any offer to buy, any particular security, strategy, or investment product. This publication does not consider your particular investment objectives, financial situation, or needs, should not be construed as legal, tax, financial or other advice, and is not to be relied upon in making an investment or other decision.
Certain information contained herein has been obtained or derived from unaffiliated third-party sources and, while Prairie Capital Management Group, LLC (“Prairie Capital”) believes this information to be reliable, makes no representation or warranty, express or implied, as to the accuracy, timeliness, sequence, adequacy, or completeness of the information. The information contained herein, and the opinions expressed herein, are those of Prairie Capital as of the date of writing, are subject to change due to market conditions and without notice and have not been approved or verified by the United States Securities and Exchange Commission (the “SEC”), the Financial Industry Regulatory Authority (“FINRA”), or by any state securities authority. This publication is not intended for redistribution or public use without Prairie Capital’s express written consent.
1 Source: Bloomberg, FactSet, Federal Reserve, J.P. Morgan Asset Management. Market expectations are based off of USD Overnight Index Swaps. *Long-run projections are the rates of growth, unemployment and inflation to which a policymaker expects the economy to converge over the next five to six years in absence of further shocks and under appropriate monetary policy. Forecasts are not a reliable indicator of future performance. Forecasts, projections, and other forward-looking statements are based upon current beliefs and expectations. They are for illustrative purposes only and serve as an indication of what may occur. Given the inherent uncertainties and risks associated with forecasts, projections or other forward-looking statements, actual events, results or performance may differ materially from those reflected or contemplated. Data as of 12/31/24.
2 Source: FactSet, Standard & Poor’s, Morningstar, Morgan Stanley. Magnificent Seven positions include the A and C share class for Alphabet. Data as of 12/31/24.
Related Learning

January 27, 2025