First Quarter 2025 and April Market Update

First Quarter 2025 and April Market Update
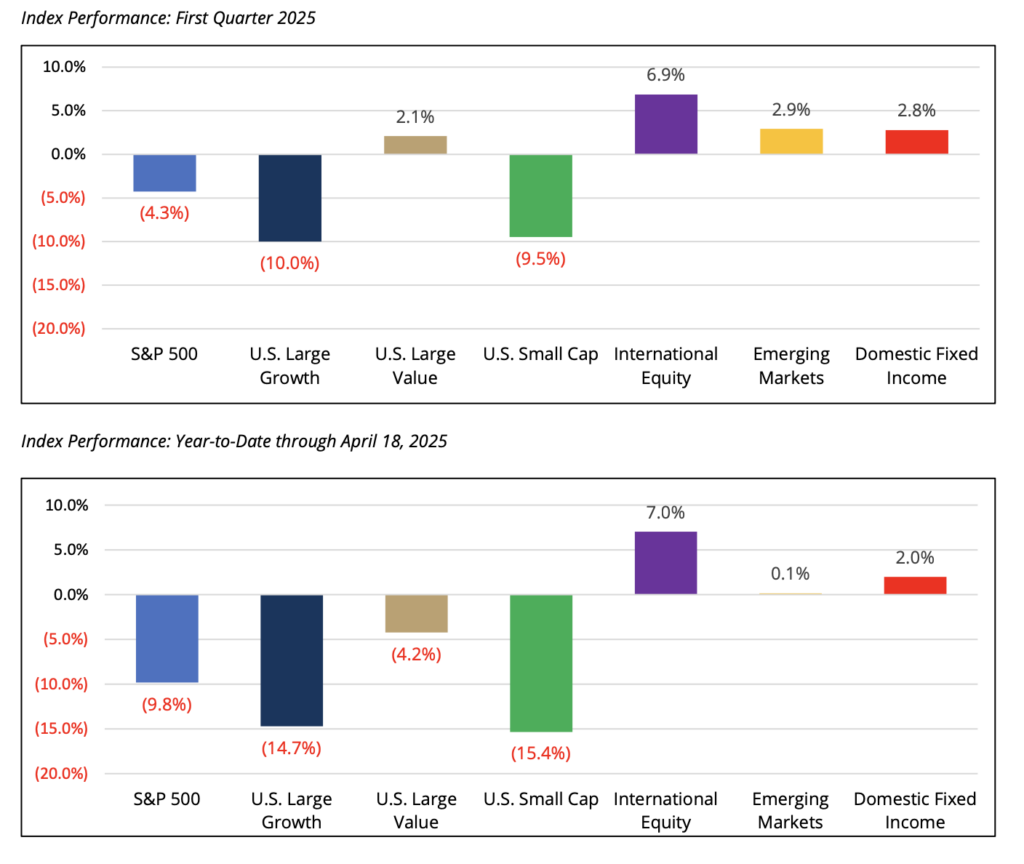
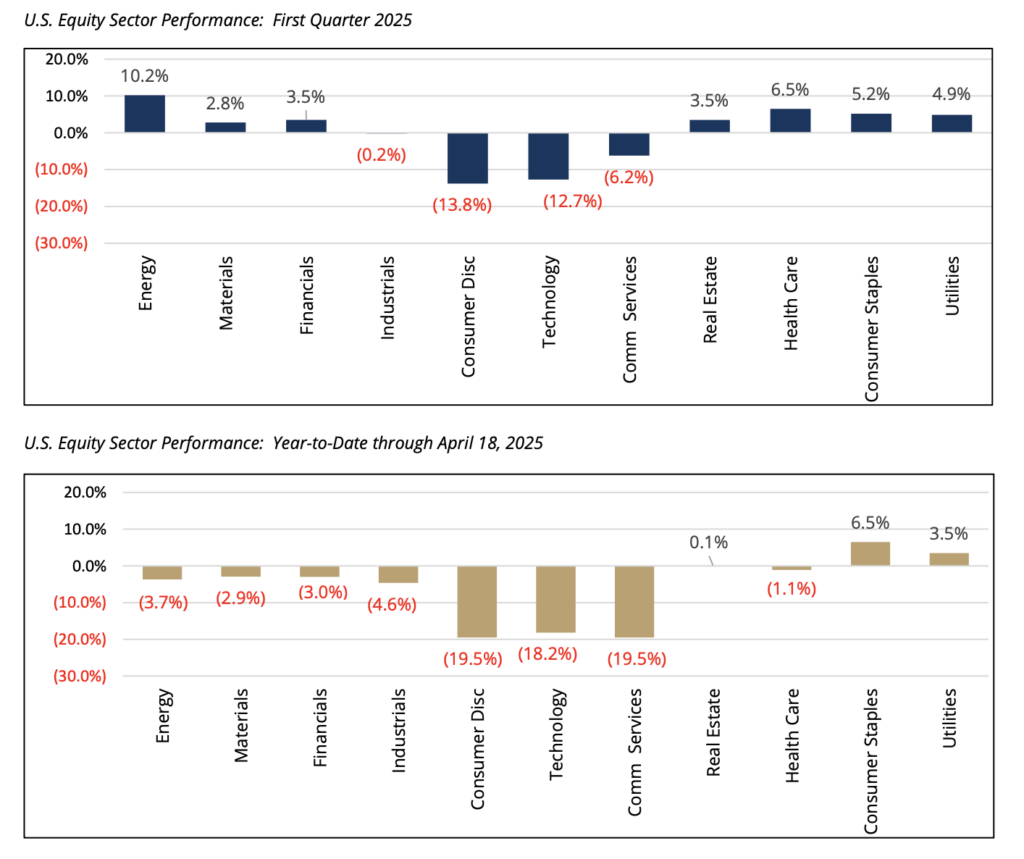
The first quarter of 2025 delivered mixed results across asset classes as concerns related to global tariffs and the increased probability of a recession in the United States created headwinds to performance. The S&P 500 Index returned -4.3% during the period, underpinned by the negative performance of consumer discretionary and mega-capitalization technology stocks. Following two consecutive years of strong performance, U.S. mega-capitalization stocks, namely those who are positioned as market leaders in artificial intelligence (“AI”), started to trade lower in February and continued their downward trajectory in March following the release of China’s AI large language model, DeepSeek. DeepSeek was allegedly developed at a fraction of the cost as U.S. competitors which created volatility for certain semiconductor companies and questioned the perceived barriers of entry in AI. Despite the volatility, seven out of the eleven S&P 500 sectors were positive for the quarter, led by energy (+10.2%) and other defensive-oriented sectors such as healthcare (+6.5%), consumer staples (+5.2%) and utilities (+4.9%). From a market-cap perspective, U.S. small cap companies underperformed relative to U.S. large cap, returning -9.5% for the quarter as measured by the Russell 2000 Index.
Developed international equities, as measured by the MSCI EAFE Index, returned +6.9% for the quarter. Developed international equities were supported by a weakening U.S. dollar and European countries implementing increased fiscal spending initiatives. This included Germany earmarking nearly €1 trillion for defense and infrastructure spending, as well as the European Union’s €800 billion defense program.
Fixed income markets were positive for the quarter with the Bloomberg U.S. Aggregate Bond Index returning +2.8%. Positive performance for the index was driven primarily by the decline in U.S. Treasury yields, reflecting a flight to safety among investors amid the market volatility and increased chances of a recession. The 10-year U.S. Treasury rate declined 0.35%, ending the period at 4.23%. U.S. credit spreads widened modestly during the period driven by the increased economic uncertainty; however, the Bloomberg U.S. Investment Grade and High Yield Corporate Credit indices returned +2.3% and +1.0%, respectively, for the quarter.
Shortly after quarter end, on April 2nd President Donald Trump announced sweeping global tariffs that have led to increased market volatility. While the announced tariffs were widely anticipated, the breadth and magnitude surprised markets. Recent weeks have seen significant volatility across both equity and fixed income markets, which have been described with terms such as jarring, unnerving, disorienting, and alarming. The week of April 7th exemplified this turbulence: the S&P 500 Index initially posted its worst four-day decline (over 12%) since the onset of the COVID pandemic in 2020. Markets subsequently reversed course sharply upon news of a 90-day temporary pause impacting certain reciprocal tariffs (excluding those related to China). This rebound included the index’s largest single-day gain (+9.5%) since the Great Financial Crisis (2008). As history often demonstrates, such periods of heightened volatility tend to cluster.
Year-to-date through April 18th, the S&P 500 Index is down approximately -9.8%, while U.S. growth equities and U.S. small capitalization equities are down -14.7% and -15.4%, respectively. Performance trends that began in March have continued in April with defensive-oriented U.S. sectors outperforming cyclicals. Developed international equities traded down approximately 5% immediately following the announced tariffs but have since stabilized. Through April 18th, developed international equities have returned +8.0% year-to- date. Equity markets in Asia have not been spared from the market drawdown, particularly in export-driven economies such as China. While Asian markets continue to whipsaw, as of April 18th, the MSCI China Index was down -7.8% in April, but still up +6.0% year-to-date following its strong performance of +15.0% in the first quarter. The MSCI AC Asia Index has returned -0.7% year-to-date. In fixed income markets, the Bloomberg U.S. Aggregate Bond Index has declined approximately -0.8% month-to-date in April, bringing year-to-date performance to +2.0%. Since the announced tariffs, the U.S. yield curve has steepened as the market grapples with economic growth and inflation expectations, as well as negative sentiment related to the U.S. fiscal deficit and foreign countries potentially reducing their ownership of U.S. Treasuries. As a result, longer-dated 30- year and 10-year U.S. Treasury rates have increased modestly to 4.8% and 4.3%, respectively, while shorter- dated U.S. rates have slightly declined. U.S. Federal Reserve (“Fed”), Chairman Jerome Powell has maintained a cautious stance, indicating that strong labor market data and inflation risks prevent the need for immediate monetary easing. Said differently, it is generally believed that given the current level of inflation, the Fed will likely delay action until they believe the risk of a recession moves higher. As tariffs are expected to apply additional pressures on inflation, the increased risk of stagflation – a combination of stagnant economic growth, elevated inflation, and rising unemployment – poses a difficult challenge for the Fed.
Recent Performance: First Quarter 2025 and Year-to-Date through April 18, 2025 1
Valuations
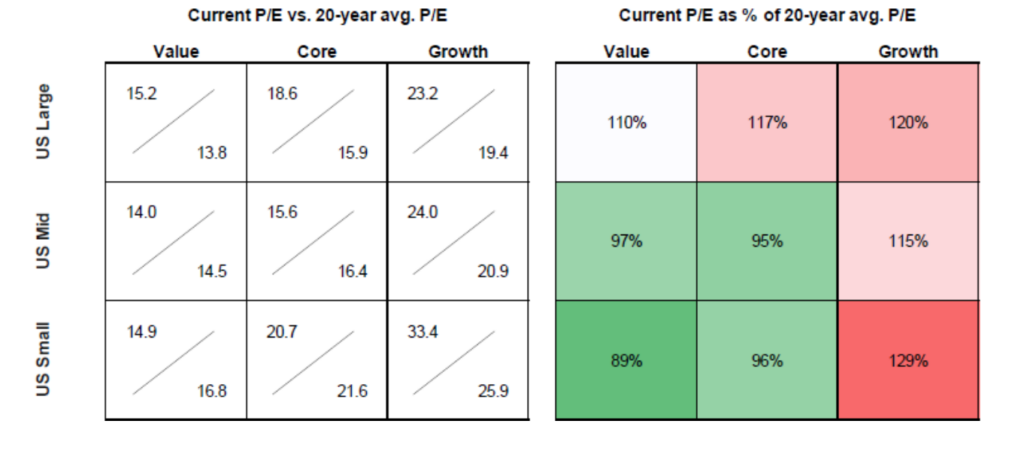
Following consecutive years of double-digit gains, U.S. equity markets, as measured by the S&P 500 Index, entered 2025 with valuations near the top decile historically. While fluid, despite the recent decline in U.S. equity markets, the forward price-to-earnings ratio for the S&P 500 Index stands at 18.6x, down from its February peak of 22.5x but still higher than its 20-year trailing average of 15.9x. Across market capitalizations and styles, U.S. core and value small and mid-cap equities are now trading at a discount to their respective 20-year average, while large-cap and growth equities across all market capitalizations are still trading at a premium. Outside the U.S., developed international equities entered the year trading at a greater than 30% discount relative to U.S. equities. That valuation gap has narrowed slightly year-to-date, but as of this writing, the MSCI EAFE Index is still trading at a 26% discount to the S&P 500 Index compared to its 20-year historical discount of 17%. Investment managers focused on ex-U.S. regions as well as those with a global investment mandate have benefited from the relative outperformance year-to-date.
Current U.S. Equity Price-to-Earnings Ratios versus 20-year Average 2
Investment Manager Comments
“The U.S. administration holds a strong view there needs to be time for pain. This is creating the worst and best of times for investing.” – Multi-Strategy Hedge Fund
With valuations in mind, the investment managers utilized by Prairie Capital are following their defined investment processes and are avoiding knee-jerk changes to portfolios. Immediately following the results of the U.S. presidential election last November, most investment managers acknowledged policy uncertainty and predicted market volatility would likely come with Donald Trump’s second presidential term. While certain managers were largely constructive on the policy priorities of the incoming administration, their optimism was also tempered given the elevated valuations for U.S. equities. As such, the managers’ portfolios entered the year with balanced exposures across sectors. Leading up to and immediately following April 2nd, managers accessed their respective portfolios to try to understand not only the direct impact from the proposed tariffs, but also the second order impact (customers, suppliers, etc.) of how a new tariff regime could change the underlying fundamentals of their investments. While tariffs are not necessarily a precursor for a recession, several managers have noted the uncertainty and rapidly changing nature of the trade agreements and policies is effectively hamstringing future investment decisions for businesses. In the meantime, certain managers have been selectively adding to defensive companies expected to outperform during a recessionary environment, while selectively reducing exposure to cyclical companies reliant on offshore manufacturing. In the event the market continues to be volatile, the managers expect to opportunistically purchase businesses where they hold a differentiated view on future earnings. This includes situations where depressed share prices reflect a permanent infliction of financial harm due to tariffs, while there might be only a finite and short-lived impact with minimal impairment to the long-term earnings power of the company.
Diversification and Staying Invested Amid Market Volatility
While the recently announced pause in reciprocal tariffs has allowed market participants a moment to catch their breath, significant uncertainty persists. Markets are now pricing in a higher probability of recession, and meaningful risks remain for both economic growth (to the downside) and inflation (to the upside).
Consequently, we expect volatility to remain elevated, driven by the rapid pace of news flow, shifts in administration policy or messaging, reactions from global trading partners, and potential changes in consumer behavior.
Historically, investors have generally been rewarded for “staying the course” and remaining invested through volatile periods such as the current environment. Attempting to time market movements has consistently proven difficult, particularly during periods of extreme volatility. Therefore, we continue to strongly advocate for diversification across portfolios, positioning for a range of potential outcomes, and maintaining a steadfast focus on long-term objectives.
We believe that a well-defined long-term plan, coupled with prudent risk management and close collaboration with your advisory team, provides the strongest foundation for ensuring your portfolio is well-positioned to meet your goals, especially during challenging market conditions. We remain committed to helping clients navigate turbulence in markets and are available to discuss your specific circumstances. As always, we appreciate the trust and confidence that you have placed in Prairie Capital.
Sincerely,
Prairie Capital Management Group, LLC
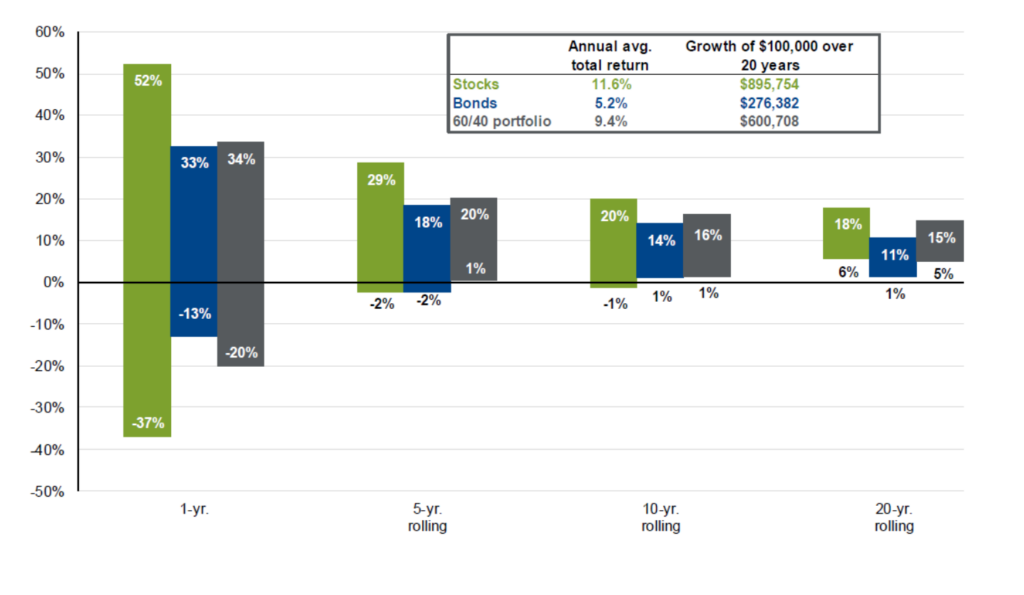
Staying the Course: Time, Diversification, and Volatility of Returns 3
Range of Returns for Stocks, Bonds, and Blended 60/40 Portfolio
Time Period: 1950 – 2024
Important Disclosures
Past performance is not an indication of future results. This publication does not constitute, and should not be construed to constitute, an offer to sell, or a solicitation of any offer to buy, any particular security, strategy, or investment product. This publication does not consider your particular investment objectives, financial situation, or needs, should not be construed as legal, tax, financial or other advice, and is not to be relied upon in making an investment or other decision.
Certain information contained herein has been obtained or derived from unaffiliated third-party sources and, while Prairie Capital Management Group, LLC (“Prairie Capital”) believes this information to be reliable, makes no representation or warranty, express or implied, as to the accuracy, timeliness, sequence, adequacy, or completeness of the information. The information contained herein, and the opinions expressed herein, are those of Prairie Capital as of the date of writing, are subject to change due to market conditions and without notice and have not been approved or verified by the United States Securities and Exchange Commission (the “SEC”), the Financial Industry Regulatory Authority (“FINRA”), or by any state securities authority. This publication is not intended for redistribution or public use without Prairie Capital’s express written consent.
1 Performance shown for the following indices: S&P 500 (TR), Russell 1000 Growth Index, Russell 1000 Value Index,Russell 2000 Index, MSCI EAFE Index, MSCI Emerging Markets Index, and the Bloomberg U.S. Aggregate Bond Index.
2 Source: Morningstar, Russell Investment Group, Standard & Poor’s, FactSet, J.P. Morgan Asset Management. Theprice-to-earnings is a bottom-up calculation based on the most recent index price divided by consensus estimatesin the next 12 months. Data as of 4/21/2025.
3 Source: J.P. Morgan Guide to the Markets. Bloomberg, FactSet, Federal Reserve, Standard & Poor’s,Strategas/Ibbotson, J.P. Morgan Asset Management. Returns shown are based on calendar year returns from 1950 to 2024. Bonds represent Strategas/Ibbotson for periods prior to 1976 and the Bloomberg Aggregate Bond Indexthereafter. Growth of $100,000 is based on annual average total returns from 1950 to 2024. U.S. data are as of March 31, 2025.
Related Learning

July 30, 2024