Second Quarter 2024 Market Update

“While we acknowledge the resilience of the U.S. economy, we remain cautious in our outlook as we believe there are more potential downside risks to the market due to elevated inflation, stretched risk asset valuations, geopolitical tensions, global fiscal policy (particularly in the U.S.), and the impact of elevated interest rates on the economy.” – Private Credit Manager
Second Quarter 2024 Market Update
As the calendar turns and the first half of 2024 is in the books, markets continued to advance higher, nearing all-time highs as measured by broad-market indices, including the S&P 500 Index, which has now gone over 340 trading days without a decline of 2%, the longest stretch in decades. Investors continued to shrug off mixed economic signals, signs of slowing growth, and sticky inflation metrics and remain laser-focused on the Federal Reserve’s (the “Fed”) path forward for interest rates. As inflation continues to be somewhat elevated, market expectations for the timing of rate cuts have been pushed out. The most recent Consumer Price Index (“CPI”) measures still note inflation above 3%, exceeding the Fed’s long-term targets. As such, the policymakers’ latest “dot plot” (a quarterly chart noting their projections for short-term interest rates) indicates only one rate cut between now and the end of the year, a significantly more hawkish projection as compared to the beginning of the year.
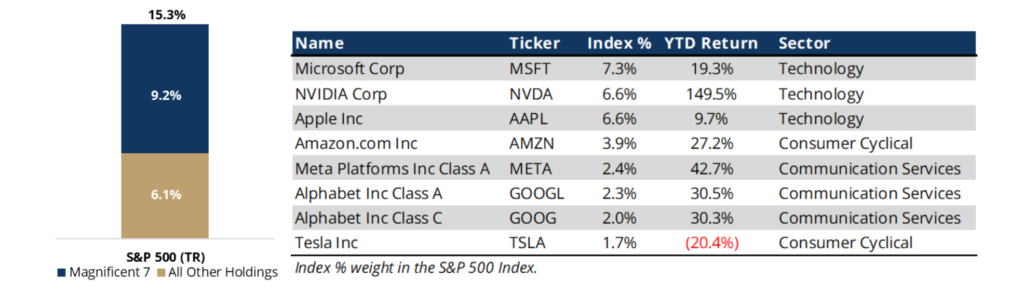
Domestic equity markets, as measured by the S&P 500 Index, gained +4.3% during the second quarter and are up +15.3% for the year. Interestingly, of the 11 sectors in the index, less than half were positive for the period, and only three had positive returns above 1%. Technology stocks posted gains of +13.8% for the quarter and have been the best performing sector over the course of the year (+28.2% year-to-date; “YTD”), followed closely by communications services which were up +9.4% for the period (+26.7% YTD). Materials, industrials, and energy were the worst performing sectors during the second quarter, all posting negative returns (-4.5%, -2.9%, and -2.4%, respectively). Year-to-date, all 11 sectors are positive except real estate (-0.8% for the period, and -1.9% YTD) as higher interest rates have continued to put pressure on the sector. Like previous periods, equity market leadership has been concentrated within mega-cap technology and communication services companies that are seen to be beneficiaries of artificial intelligence. At the end of the quarter, the top 10 stocks in the S&P 500 Index represented a staggering 37% of the overall index market capitalization. The smaller subset known as the “Magnificent Seven” accounted for over 60% of the index return YTD, highlighting the low level of market breadth. Said differently, if the constituent companies in the S&P 500 Index were weighted equally rather than by market capitalization, the index return would be +5.1% versus +15.3% YTD.
S&P 500 (TR) Year-to-Date Performance: +15.3%
“Magnificent Seven” accounted for over 60% of the index return YTD.1
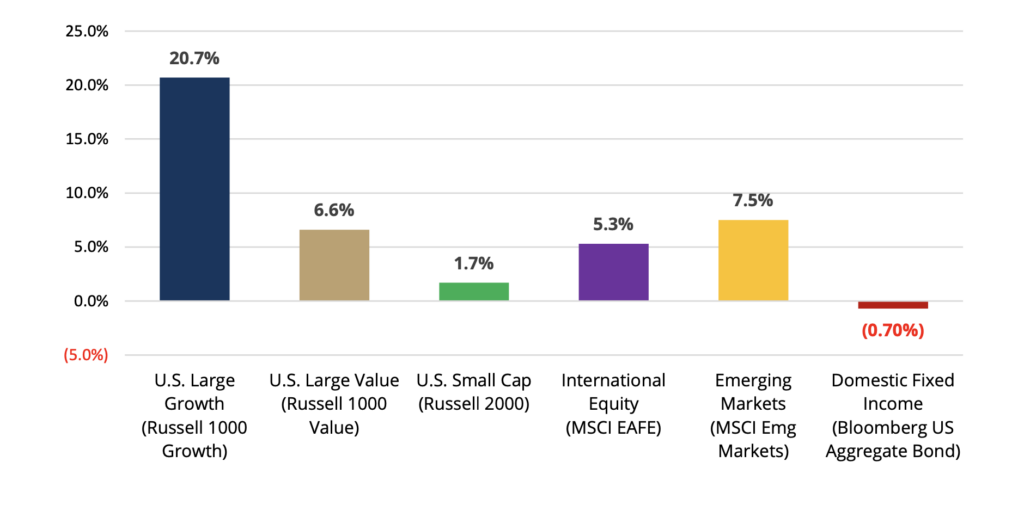
From a style perspective, domestic growth stocks (+20.7% YTD) have continued to significantly outperform value stocks (+6.6% YTD), as measured by their respective Russell 1000 benchmark indices. Mid- and small-cap stocks have underperformed large caps for the second straight period. Small-cap stocks, as measured by the Russell 2000 Index, were negative during the quarter (-3.3%) and are only up +1.7% YTD, severely underperforming their large-cap counterparts. Outside of domestic markets, international developed stocks posted slightly negative returns for the quarter (-0.4%), however, remain positive on the year (+5.3%) as measured by the MSCI EAFE Index. Emerging markets posted strong gains over the quarter, +5.0% as measured by the MSCI Emerging Markets Index in USD terms, and slightly outperformed domestic equity markets. Most emerging market economies are further along into interest rate cutting cycles, having started earlier, which has led to improving growth metrics. In addition, a rebound in Chinese equities also helped buoy returns.
After a challenging start to 2024, fixed income markets rebounded, and finished the period slightly positive (+0.1%), although still negative YTD (-0.7%) as measured by the Bloomberg U.S. Aggregate Bond Index. Within the fixed income universe, short-dated investment grade corporate and high-yield bonds performed best as credit spreads tightened, whereas intermediate and long-dated U.S. Treasuries performed worst with slightly negative returns. The 10-year U.S. Treasury yield spiked approximately 40 basis points (i.e., 0.40%) in April before coming back down and ending the quarter at 4.4%. The yield curve continues to be inverted, with the 2-year U.S. Treasury yield ending the quarter at 4.7%. Commodities achieved modest gains over the period, with industrial and precious metals posting strong returns whereas agriculture was the weakest component. The price of gold rose during the quarter, reaching an all-time high of over $2,450 an ounce, before settling back down to $2,326 at quarter-end. Oil prices were relatively flat over the period and the USD slightly appreciated versus a basket of foreign currencies.
Index YTD Performance: Equity and Fixed Income
A Closer Look at Valuations
“Most equities, private as well as publicly traded, are, or recently were, as expensive or close to as expensive as they have ever been. Profit margins are toward the very high end of a range that spans many decades. From such conditions of valuation and profitability, forward rates of return tend to be low. This historical and mathematical fact can get lost in the excitement when stocks are on a tear.” – Hedge Fund Manager
Valuations are an important and closely studied metric for market participants. History and data have consistently shown that there is very little correlation between current valuation metrics and short-term returns, but much higher correlation with intermediate and long-term returns. Said differently, entry-point valuations have been a less meaningful predictor of returns in the short-term but are very important over the long-term. Today, at the headline level, valuations for the broader domestic equity market appear expensive or, at the very least, fully valued. At quarter-end, the S&P 500 Index was trading with a forward price to earnings (“P/E”) ratio of 21.0x, versus its 30-year average of 16.7x, meaning that for every dollar of earnings generated by these 500 stocks, investors today are paying over 25% more than historical norms. Examining almost any other traditional valuation metric (price-to book, price-to-cashflow, dividend yield, etc.) shows a similar conclusion.
We believe a closer look is warranted, however, and that the statistics may not look as discouraging to investors when diving a bit deeper. Within domestic large-cap equities (i.e., the S&P 500 Index), the top 10 stocks are trading at P/E ratios of 30.3x. Conversely, the remaining 490 stocks were trading at 17.6x – a number that is only slightly higher than long-term averages. The equally weighted S&P 500 Index was even trading below long-term averages (16.3x at quarter-end). Given the concentration within the index, as well as the staggering performance of a small cohort of mega-cap technology stocks, the overall index valuation metrics may not tell the entire story. Given their relative underperformance, valuations of mid- and small-cap stocks also provide an interesting data point, trading at approximately 15x and 14x earnings, respectively (as measured by the S&P 400 and S&P 600 indices), a historical divergence compared to large-caps. Just as small- and mid-cap stocks appear cheap versus large caps, a similar pattern exists with equity markets outside the U.S., where valuations appear cheap on both an absolute and relative basis. The MSCI ACWI ex-U.S. Index finished the quarter with a forward P/E ratio of 13.5x. Although this is slightly above its long-term (20-year) average of 13.0x, the discount relative to U.S. stocks is approximately two standard deviations below its historic averages. In summary, for investors willing to look outside of the Magnificent Seven and mega-cap growth stocks, valuations appear to be much more reasonable in other areas of the market.
Final Thoughts
“…the rising tide of amnesia toward risk is concerning, and we believe vigilance and discipline are as important as ever.” – Domestic Equity Manager
In our last quarterly note, we touched upon the mixed signals present in the economic landscape. The environment remains equally perplexing today as we enter the second half of the year. Although the overall environment has remained positive for markets and YTD headline returns have been strong, there appears to be an ever-widening divide between market performance and underlying economic reality. GDP growth has continued to be positive, however, economic data is softening, growth is slowing, and labor markets appear to be weakening. The consumer looks to be stretched thin, with troubling signs including falling retail sales and personal consumption expenditures, and savings rates down nearly 90% from their pandemic era peak. Interestingly, all of this is taking place at time when equities continue to hit a virtually uninterrupted sequence of all-time highs, in a market that has almost never been as concentrated as it is today.
Considering the above, it feels as though things are perhaps priced to perfection and risks may be skewed to the downside. For these reasons, we continue to advocate for a disciplined investment approach, appropriate diversification, and a sound long-term investment plan that can allow investors to weather a wide variety of market conditions and outcomes. To be clear, we have and continue to see interesting opportunities in some areas of the market that haven’t fully participated in the rally and are trading at reasonable valuations, as well as opportunities in traditional fixed income and private credit, where both current yields as well as total return potential look attractive. We remain acutely aware of and focused on risk management in an effort to achieve compelling risk-adjusted returns for clients over full market cycles.
As always, we welcome the opportunity to discuss your portfolio in detail and appreciate the trust and confidence that you have placed in Prairie Capital. We look forward to connecting throughout the course of the year.
Important Disclosures
Past performance is not an indication of future results. This publication does not constitute, and should not be construed to constitute, an offer to sell, or a solicitation of any offer to buy, any particular security, strategy, or investment product. This publication does not consider your particular investment objectives, financial situation, or needs, should not be construed as legal, tax, financial or other advice, and is not to be relied upon in making an investment or other decision.
Certain information contained herein has been obtained or derived from unaffiliated third-party sources and, while Prairie Capital Management Group, LLC (“Prairie Capital”) believes this information to be reliable, makes no representation or warranty, express or implied, as to the accuracy, timeliness, sequence, adequacy, or completeness of the information. The information contained herein, and the opinions expressed herein, are those of Prairie Capital as of the date of writing, are subject to change due to market conditions and without notice and have not been approved or verified by the United States Securities and Exchange Commission (the “SEC”), the Financial Industry Regulatory Authority (“FINRA”), or by any state securities authority. This publication is not intended for redistribution or public use without Prairie Capital’s express written consent.
1 Source: FactSet, Standard & Poor’s. The Magnificent 7 positions include the A and C share class for Alphabet. Holdings attribution in the S&P 500 is based on the performance of the Magnificent 7 stocks, indexed to 100 on 1/1/2024. Data as of 6/30/24.
Related Learning

May 23, 2024