Second Quarter 2025 Market Update

Second Quarter 2025 Market Update
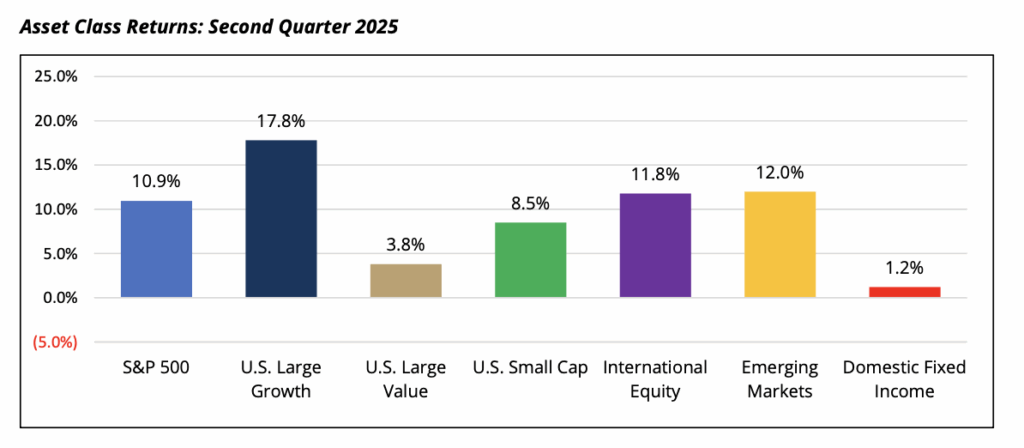
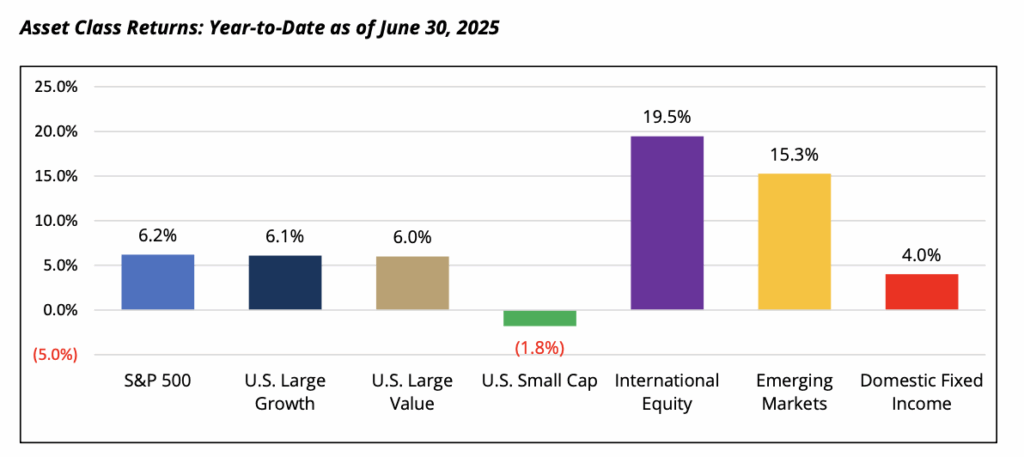
The second quarter of 2025 started with significant market volatility as sweeping global tariffs were announced by President Donald Trump on April 2nd. While widely anticipated, the breadth and magnitude of the tariffs announced on Liberation Day surprised markets and fueled fears of a recession in the U.S. The week of April 7th exemplified the market turbulence with the S&P 500 Index posting its worst four-day decline (over 12%) since the onset of the COVID pandemic in 2020 and dropped nearly 20% from its previous high in February. U.S. small cap equities, as measured by the Russell 2000 Index, were also down over 15% by mid-April. The sell-off was dramatic but proved to be short-lived as markets subsequently reversed course sharply upon the news of a 90-day temporary pause on certain reciprocal tariffs. By quarter end, the S&P 500 Index retraced all earlier losses and reached a new all-time high by late June, returning +10.9% for the period (+6.2% YTD). The significant rebound was supported by improved investor sentiment following the tariff pause, strong corporate earnings reported by mega-cap technology companies, and resilient macroeconomic data. While defensive-oriented U.S. sectors outperformed in the first quarter and early April, cyclical sectors outperformed in the second quarter. Enthusiasm for artificial intelligence also returned in the second quarter, highlighted by several companies that are part of the “Magnificent Seven” (e.g., NVIDIA, Microsoft, Meta Platforms, Alphabet). During the quarter, these companies reported earnings that exceeded market expectations and, importantly, maintained guidance for billions of capital expenditures on AI initiatives. Eight out of the eleven S&P 500 sectors were positive for the period, led by information technology (+23.7% Q2; +8.1% YTD) and communication services (+18.5% Q2; +11.1% YTD). Energy (-8.6% Q2; +0.8% YTD) and healthcare (-7.2% Q2; -1.1% YTD) were sectors with notable negative performance, as lower commodity prices and policy and regulatory risks served as headwinds, respectively. From a market cap perspective, U.S. small cap equities, as measured by the Russell 2000 Index, also rebounded strongly from April lows, returning +8.5% for the quarter but remain negative for the year with a return of -1.8%.
Developed international equities, as measured by the MSCI EAFE Index, returned +11.8% for the quarter, bringing year-to-date performance to +19.5%. Following several years of underperformance relative to U.S. equities, developed international equity indices have outpaced their U.S. peers thanks to a weakening U.S. dollar, supportive fiscal spending initiatives in both Europe and Asia, and discounted relative valuations that have attracted increased investor flows. Even with the recent outperformance, the forward price-to-earnings ratio for the MSCI EAFE Index is still trading at a 31% discount to the S&P 500 Index compared to its 20-year historical discount of 17%. Emerging market equities were also positive for the period, returning +12.0% (+15.3% YTD).
Fixed income markets were positive for the quarter with the Bloomberg U.S. Aggregate Bond Index returning +1.2%, bringing year-to-date performance to +4.0%. Following the announced tariffs, the U.S. yield curve steepened as the market grappled with economic growth and inflation expectations, as well as negative sentiment related to the U.S. fiscal deficit. 20-year and 30-year U.S. Treasury yields increased modestly, while shorter-dated U.S. rates declined in anticipation for interest rate cuts in the second half of the year. The 10- year U.S. Treasury rate ended the period at 4.2%. U.S. credit spreads followed a similar path as equities with spreads widening in early April but steadily moved tighter by quarter end. The Bloomberg U.S. Investment Grade and High Yield Corporate Credit indices returned +1.8% and +3.5%, respectively, for the quarter, bringing year-to-date performance to +4.2% and +4.6%.
In commodity markets, the Bloomberg Commodities Index returned -3.1% for the quarter. Oil markets were volatile with West Texas Intermediate Oil declining -8.9%, as investors digested announced OPEC+ production increases and geopolitical risks in the Middle East. In precious metals, gold continued its strong performance, returning +5.2% during the quarter (+24.4% YTD). Gold has gained increased investor attention as an alternative to the U.S. dollar and safe haven among trade uncertainty and U.S. fiscal deficit concerns.
Investment Manager Comments & Looking Ahead
“Investors expecting President Donald Trump’s second term to be defined by volatility, economic uncertainty, unorthodox leadership, and consistently inconsistent policies were not disappointed in the first half of 2025.”– Equity Long/Short Manager
Entering 2025, the general consensus among investment managers utilized by Prairie Capital was (1) elevated U.S. equity market valuations, as measured by the S&P 500 Index, were a risk, and (2) increased market volatility would likely come with President Trump’s second presidential term.
Starting with the latter, the consensus has lived up to expectations. Tariff announcements and reversals have caused equity markets to whipsaw, while geopolitical risks in the Middle East, ongoing conflict between Ukraine and Russia, and uncertainty over “Big Beautiful Bill” negotiations in the United States, focused mainly on future government spending and tax cuts, resulted in an eventful first half of the year. The uncertainty surrounding future trade policy has posed challenges for corporate management teams, complicating decisions with regards to strategic planning and supply chain management. The volatility undermines pricing strategies and margin forecasts, and as a result, some businesses are delaying investments until there is more clarity. The concern among investment managers is the tariffs will apply additional pressures on inflation and economic growth, as market pundits are assuming a baseline minimum tariff of 10% on nearly all imported goods in the U.S. (higher for certain countries based on trade barriers, e.g., China), which is an increase from the approximate 2% rate at the end of 2024. A scenario of stagnant economic growth, elevated inflation, and rising unemployment – known as stagflation – also leads to a difficult challenge for the U.S. Federal Reserve (“Fed”) to manage its dual mandate of targeted inflation and employment. While the Fed itself has forecasted two 0.25% interest rate cuts in the second half of the year despite inflation worries, the timing of future monetary actions is a perpetual debate.
Despite these risks, U.S. equity markets, as measured by the S&P 500 Index, have rebounded strongly from April lows and valuations are back to where we started the year, trading at approximately 22x forward 12- month price-to-earnings ratio relative to its 20-year trailing average of 16x. The excitement towards all things AI, including technology hardware, power providers, and cloud services, has led markets higher. There are balanced views championing the pace of innovation and transformative technology advances driven by AI, versus other market participants who voice concerns of investor complacency and elevated valuations. Regardless of the view, the share price returns of leading AI mega-capitalization companies have meaningfully outperformed. Nvidia, the market leading technology company that designs advanced semiconductors to power AI systems, ended the period with a market capitalization of approximately $3.8 trillion. Nvidia’s market cap is now greater than the entire market capitalization of the Russell 2000 Index, and since the release of OpenAI’s ChatGPT in November 2022, Nvidia’s share price has increased by approximately 8x.
For the remainder of the year, we expect volatility to remain elevated, driven by shifts in the U.S. administration policy or messaging, reactions from global trading partners, and potential changes in consumer behavior. We continue to advocate for diversification across portfolios, positioning for a range of potential outcomes and maintaining a steadfast focus on long-term objectives. A well-defined long-term plan, coupled with prudent risk management and close collaboration with your advisory team, provides the strongest foundation for ensuring your portfolio is well-positioned to meet your goals, especially during challenging market conditions. We remain committed to helping clients navigate turbulence in markets and are available to discuss your specific circumstances. As always, we appreciate the trust and confidence that you have placed in Prairie Capital.
Sincerely,
Prairie Capital Management Group, LLC
Important Disclosures
Past performance is not an indication of future results. This publication does not constitute, and should not be construed to constitute, an offer to sell, or a solicitation of any offer to buy, any particular security, strategy, or investment product. This publication does not consider your particular investment objectives, financial situation, or needs, should not be construed as legal, tax, financial or other advice, and is not to be relied upon in making an investment or other decision.
Certain information contained herein has been obtained or derived from unaffiliated third-party sources and, while Prairie Capital Management Group, LLC (“Prairie Capital”) believes this information to be reliable, makes no representation or warranty, express or implied, as to the accuracy, timeliness, sequence, adequacy, or completeness of the information. The information contained herein, and the opinions expressed herein, are those of Prairie Capital as of the date of writing, are subject to change due to market conditions and without notice and have not been approved or verified by the United States Securities and Exchange Commission (the “SEC”), the Financial Industry Regulatory Authority (“FINRA”), or by any state securities authority. This publication is not intended for redistribution or public use without Prairie Capital’s express written consent.
Definition: “YTD” = Year-to-Date.
Related Learning
December 20, 2025