
Second Quarter 2026 Market Update

Second Quarter 2026 Market Update
The second quarter of 2026 delivered a broad recovery across global markets, as news of a U.S. and Iran peace agreement and better than expected first quarter earnings season restored investor risk appetite. The MSCI All Country World Index returned +14.9% (+11.3% YTD) and the Bloomberg U.S. Aggregate Bond Index gained +0.7% (+0.6% YTD). Market leadership was broad but uneven, with growth-oriented equities, emerging markets, and AI technology-linked segments posting the strongest returns, while commodities surrendered a portion of their first quarter surge.
Domestic equities, as measured by the S&P 500 Index, returned +15.2% for the quarter (+10.2% YTD), the index’s strongest three-month advance since the second quarter of 2020. Gains extended across the capitalization and style spectrum, supported by stronger-than-expected corporate earnings, a renewed rotation into AI-related beneficiaries, and improving market breadth beyond mega-cap technology. Smaller companies participated meaningfully in the advance, as mid-cap and small-cap stocks outperformed their large-cap counterparts. The Russell 2000 Index led the headline benchmarks, up +21.5% for the quarter (+22.6% YTD), ahead of the Russell Mid Cap Index, which was up +13.8% (+15.3% YTD). At the sector level, information technology (+31.8% Q2, +19.8% YTD) outperformed, led by beneficiaries of accelerated investments in semiconductors, hardware, and AI infrastructure, while industrials (+14.9% Q2, +20.2% YTD) also finished higher. Energy (-13.5% Q2, +19.7% YTD) was the primary laggard for the quarter as oil prices declined sharply after the U.S. and Iran agreed to a peace framework in June, though it remains positive year-to-date. Factor results skewed toward higher beta exposures, with S&P 500 Momentum up +44.4% (+36.2% YTD) and S&P 500 High Beta up +34.4% (+33.7% YTD).
International equities advanced alongside domestic markets, with emerging markets outpacing developed markets. Developed international equities, as measured by the MSCI EAFE Index, returned +10.8% for the quarter (+9.4% YTD), while emerging market equities, as measured by the MSCI Emerging Markets Index gained +24.1% (+23.9% YTD). Much of the strength was concentrated in Asia, where semiconductor manufacturers and technology hardware companies benefited from sustained demand tied to the AI investment cycle. South Korea and Taiwan were among the strongest performing markets, while Japan benefited from favorable currency dynamics and ongoing corporate governance reforms. In Europe, equity markets rebounded on easing geopolitical concerns; however, cyclical and value-oriented sectors in the
region have underperformed year-to-date driven by the spike in inflation since the onset of war in Iran. In response to the inflationary pressures, the European Central Bank hiked interest rates by 0.25% in June, the first rate increase since 2023.
Fixed income markets delivered positive, albeit modest, returns as yields eased from their intra-quarter peaks and credit spreads narrowed. Credit sensitive sectors generally outperformed government bonds, reflecting healthy corporate fundamentals and improving investor confidence. The Bloomberg U.S. Aggregate Bond Index returned +0.7% for the quarter (+0.6% YTD), while the Bloomberg High Yield Corporate Bond Index rose +2.5% (+2.0% YTD). Yields remained elevated, with the 10-year Treasury ending the quarter near 4.5%, as inflation remained above the Federal Reserve’s target and economic growth proved resilient. The Federal Reserve, now under Chair Kevin Warsh, held short-term interest rates unchanged at 3.50% to 3.75%, and investors have increasingly shifted away from expectations for near-term rate cuts. Municipal bonds, as measured by the Bloomberg Municipal Bond Index, also finished higher (+2.5% Q2, +2.3% YTD), supported by attractive yields and stable credit conditions.
Commodity and real asset performances were mixed, as publicly listed real estate posted gains while the broader commodity complex weakened. After a sharp first quarter rally driven by geopolitical tensions, oil prices retreated substantially as supply disruption concerns eased and diplomatic progress reduced fears surrounding global energy markets. Precious metals also pulled back from an exceptional run as demand for traditional safe-haven assets moderated. The Bloomberg Commodity Index fell -8.1% for the quarter (+14.4% YTD), with its energy sub-index down -13.4% (+38.7% YTD) and the precious metals sub-index off – 14.9% (-7.6% YTD). Publicly traded real estate securities were an exception as the FTSE Nareit All Equity REITs Index rose +10.8% (+14.5% YTD), drawing support from steady economic growth and resilient property fundamentals, contributing positively to diversified portfolios.
AI Disruption and Uneven Returns in the Technology Sector
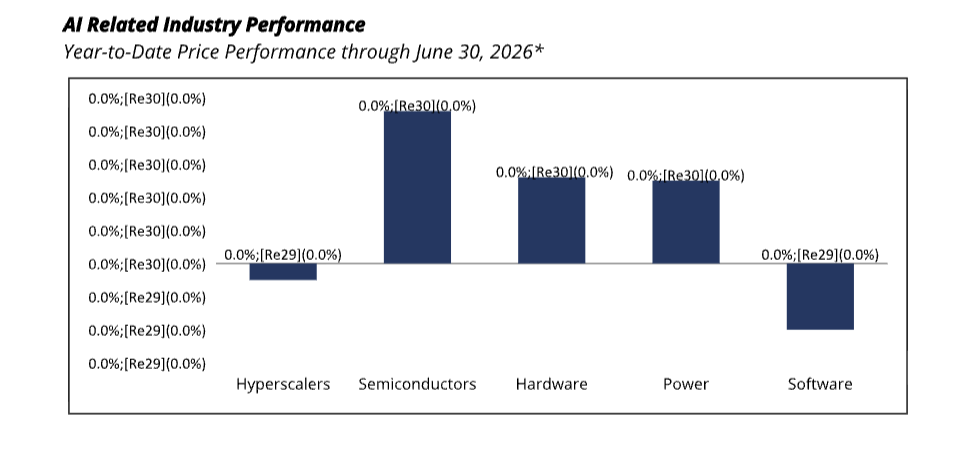
When taking a closer look at AI themes that have dominated returns for global equity markets year-to-date, the market has drawn an early line between perceived winners and losers. Semiconductors (+46%), hardware (+26%), and power (+25%) sub sectors have outperformed, driven by positive earnings expectations given strong demand for the foundational supply chain to build out AI models. On the losing side, hyperscalers, cloud service providers that offer computing storage and infrastructure, have declined – 5% year-to-date as investors have started to question the sustainability of their substantial capital expenditures (>$700 billion in 2026) and skepticism over AI monetization. The negative performance year- to-date for hyperscalers returns a small portion of the outsized gains experienced in the previous three years (>100% cumulative return from 2023-2025). Lastly, software has declined -20% due to structural fears of being disrupted by AI. For active investment managers, relative performance for the year can largely be attributed to exposures to these sub sectors.
As always, we welcome the opportunity to discuss your portfolio in detail and appreciate the trust and confidence that you have placed in Prairie Capital. We look forward to connecting with you soon.
Sincerely,
Prairie Capital Management Group, LLC
Important Disclosures
Source: FactSet, MSCI, Standard & Poor’s, J.P. Morgan Asset Management. Data as of 06/30/26. Hyperscalers is a market-weighted composite of AMZN, GOOGL/GOOG, META, MSFT, and ORCL. The remaining categories are based on GICS Industries. Semis = Semiconductors & Semiconductor Equipment Info. Tech.); Hardware = market- weighted composite of Communications Equipment (Info. Tech.), Electronic Equipment Instruments & Components
(Info. Tech.) and Technology Hardware Storage & Peripherals (Info. Tech.); Power = market-weighted composite of Electrical Equipment (Industrials) and Electric Utilities (Utilities); Software = Software (Info. Tech.). Hyperscalers that fall in category industries are included in both the hyperscaler and that additional category.
Past performance is not an indication of future results. This publication does not constitute, and should not be construed to constitute, an offer to sell, or a solicitation of any offer to buy, any particular security, strategy, or investment product. This publication does not consider your particular investment objectives, financial situation, or needs, should not be construed as legal, tax, financial or other advice, and is not to be relied upon in making an investment or other decision.
Certain information contained herein has been obtained or derived from unaffiliated third-party sources and, while Prairie Capital Management Group, LLC (“Prairie Capital”) believes this information to be reliable, makes no representation or warranty, express or implied, as to the accuracy, timeliness, sequence, adequacy, or completeness of the information. The information contained herein, and the opinions expressed herein, are those of Prairie Capital as of the date of writing, are subject to change due to market conditions and without notice and have not been approved or verified by the United States Securities and Exchange Commission (the “SEC”), the Financial Industry Regulatory Authority (“FINRA”), or by any state securities authority. This publication is not intended for redistribution or public use without Prairie Capital’s express written consent.
Definition: “YTD” = Year-to-Date.
Related Learning

December 20, 2025