
Third Quarter 2026 Market Update

Third Quarter 2026 Market Update
Global financial markets delivered mixed results in the third quarter of 2026, as the collapse of the U.S. and Iran ceasefire reignited an energy price shock and forced a reassessment of the interest rate outlook. Renewed attacks on shipping and energy infrastructure sent crude oil prices higher, reviving inflation concerns that had faded following June’s peace framework and prompting the U.S. Federal Reserve (“Fed”) to raise short-term interest rates for the first time since 2023. The MSCI All Country World Index returned +1.6% (+13.0% YTD), supported by continued strength in mega-cap technology, while the Bloomberg U.S. Aggregate Bond Index declined -3.5% (-2.9% YTD) as long-term yields climbed to their highest levels in nearly two decades. Risk appetite narrowed rather than retreated, with capital concentrating in the largest, most profitable companies and moving away from rate-sensitive segments of the market.
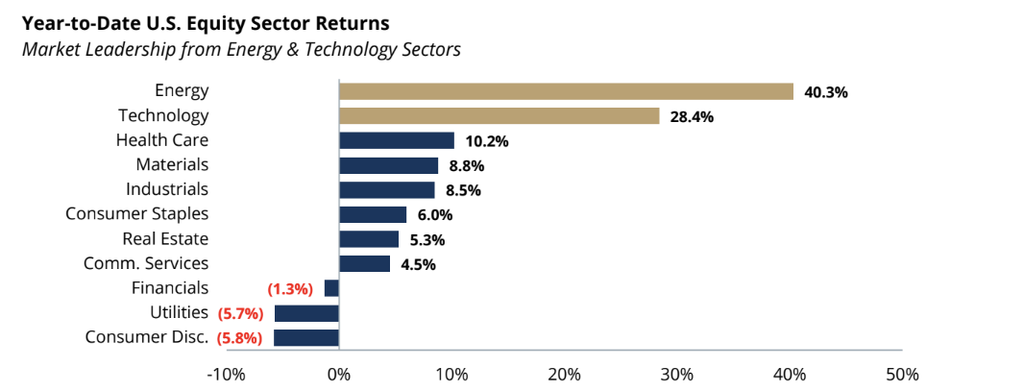
Domestic equity markets, as measured by the S&P 500 Index, returned +2.3% for the quarter (+12.8% YTD), though the headline result masked a meaningful deterioration in market breadth. Gains were concentrated among mega-cap technology and communication services companies supported by robust second quarter earnings, while the equal-weighted S&P 500 Index declined -1.9%, reversing the broadening trend that defined the first half of the year. Higher interest rates weighed on smaller companies, which tend to be more reliant on external financing, as the Russell 2000 Index fell -7.2% (+13.7% YTD) and the Russell Midcap Index declined -3.0% (+11.8% YTD), surrendering a portion of their strong second quarter gains. At the sector level, energy (+17.2% Q3, +40.3% YTD) led as the oil rally translated into higher earnings expectations, followed by information technology (+7.2% Q3, +28.4% YTD), where leadership rotated within the AI theme as software companies rebounded from steep first half losses and semiconductor stocks cooled. Utilities (-12.4% Q3, – 5.7% YTD) and industrials (-9.7% Q3, +8.5% YTD) were the primary laggards, pressured by higher discount rates and a pause in the AI infrastructure trade that lifted power and electrical equipment companies earlier
in the year.
International equity markets trailed their U.S. counterparts during the quarter, as higher energy costs, softer relative earnings momentum, and a firmer U.S. dollar late in the period offset the support of attractive relative valuations. Developed international equities, as measured by the MSCI EAFE Index, returned +0.8% (+10.3% YTD) as energy importing economies in Europe and Asia were exposed to the renewed rise in oil prices and the inflationary pressure it places on consumers and central banks. Emerging market equities, as measured by the MSCI Emerging Markets Index, declined -0.4% but remain the strongest performing major equity region year-to-date (+23.4%). The cooling in AI hardware enthusiasm weighed on the North Asian semiconductor and technology manufacturers that drove the region’s second quarter advance, while the U.S. dollar’s +2.0% gain in September reduced returns for dollar-based investors.
Fixed income markets declined during the quarter as the Fed shifted from an extended pause to renewed tightening. At its September meeting, the Fed raised the federal funds target range by 0.25% to 3.75% – 4.00%, citing persistently elevated inflation alongside solid economic growth, and updated projections pointed to one additional increase before year-end. The 10-year U.S. Treasury yield rose from 4.4% at the end of June to 5.3% at quarter-end, its highest level since 2007, as investors demanded greater compensation for inflation risk and heavy government and corporate issuance competed for capital. Duration was the primary driver of
returns, with the Bloomberg U.S. Aggregate Bond Index returning -3.5% and long-dated Treasuries, as measured by the Bloomberg US Treasury 10+ Year Index, declining -7.8%. Credit proved more stable than rates, as the Bloomberg High Yield Corporate Bond Index fell a more modest -1.8% (+0.1% YTD) given its shorter duration and higher income, and floating-rate senior loans advanced +2.0% as coupons reset higher. Municipal bonds were notably weak, with the Bloomberg Municipal Bond Index declining -6.4% (-4.2% YTD) as a longer duration profile amplified the rise in yields.
Commodity markets were dominated by a renewed surge in crude oil, as escalating supply disruptions in the Middle East erased the declines of the second quarter and a coordinated release of strategic reserves by G7 countries provided little relief. West Texas Intermediate crude oil rose +30.1% for the quarter, bringing its year-to-date gain to +57.5%. Gold gained +3.2% for the quarter but fell -6.3% in September, as rising real yields and a stronger U.S. dollar diminished the appeal of non-yielding assets. Publicly traded real estate also struggled, with the FTSE Nareit All REITs Index declining -6.7% (+6.9% YTD) as higher borrowing costs weighed
on property valuations.
AI Investment, War in Iran, and Inflation Driving Equity Market Performance
Artificial intelligence and the war in Iran have been the dominant market narratives of 2026, and each has produced episodes of volatility. The year began with expectations for lower inflation and potential rate cuts from the Fed. However, the energy shock associated with the war in Iran has lifted inflation, prompted the Fed to raise rates, and pushed long-term Treasury yields to their highest level since 2007. Even so, the S&P 500 Index is up +12.8% year-to-date, as corporate profits have largely absorbed the pressure from higher rates. Third-quarter earnings growth is expected to exceed 30% from a year earlier, driven largely by beneficiaries of the AI investment cycle and by energy companies benefiting from higher commodity prices.
Elevated U.S. equity valuations were a concern entering the year, but following strong earnings growth from these two sectors, the forward price-to-earnings ratio for the S&P 500 Index has declined from 22x to 19x. Narrow market leadership in both earnings and returns has raised questions about the economy’s growing reliance on AI-related capital spending, particularly while inflation and interest rates remain elevated. The narrow leadership is also evident in the composition of the year-to-date top performers: 31 of the top 50 S&P 500 stocks are technology companies. Looking ahead, the pace of AI monetization, financing requirements,
regulatory scrutiny of AI models, and political resistance to data center development are expected to create additional volatility for AI-related investments, with that risk heightened by the upcoming U.S. midterm elections.
As always, we welcome the opportunity to discuss your portfolio in detail and appreciate the trust and confidence that you have placed in Prairie Capital. We look forward to connecting with you soon.
Sincerely,
Prairie Capital Management Group, LLC
Important Disclosures
Past performance is not an indication of future results. This publication does not constitute, and should not be construed to constitute, an offer to sell, or a solicitation of any offer to buy, any particular security, strategy, or investment product. This publication does not consider your particular investment objectives, financial situation, or needs, should not be construed as legal, tax, financial or other advice, and is not to be relied upon in making an investment or other decision.
Certain information contained herein has been obtained or derived from unaffiliated third-party sources and, while Prairie Capital Management Group, LLC (“Prairie Capital”) believes this information to be reliable, makes no representation or warranty, express or implied, as to the accuracy, timeliness, sequence, adequacy, or completeness of the information. The information contained herein, and the opinions expressed herein, are those of Prairie Capital as of the date of writing, are subject to change due to market conditions and without notice and have not been approved or verified by the United States Securities and Exchange Commission (the “SEC”), the Financial Industry Regulatory Authority (“FINRA”), or by any state securities authority. This publication is not intended for redistribution or public use without Prairie Capital’s express written consent.
Definition: “YTD” = Year-to-Date.
Related Learning

November 12, 2026